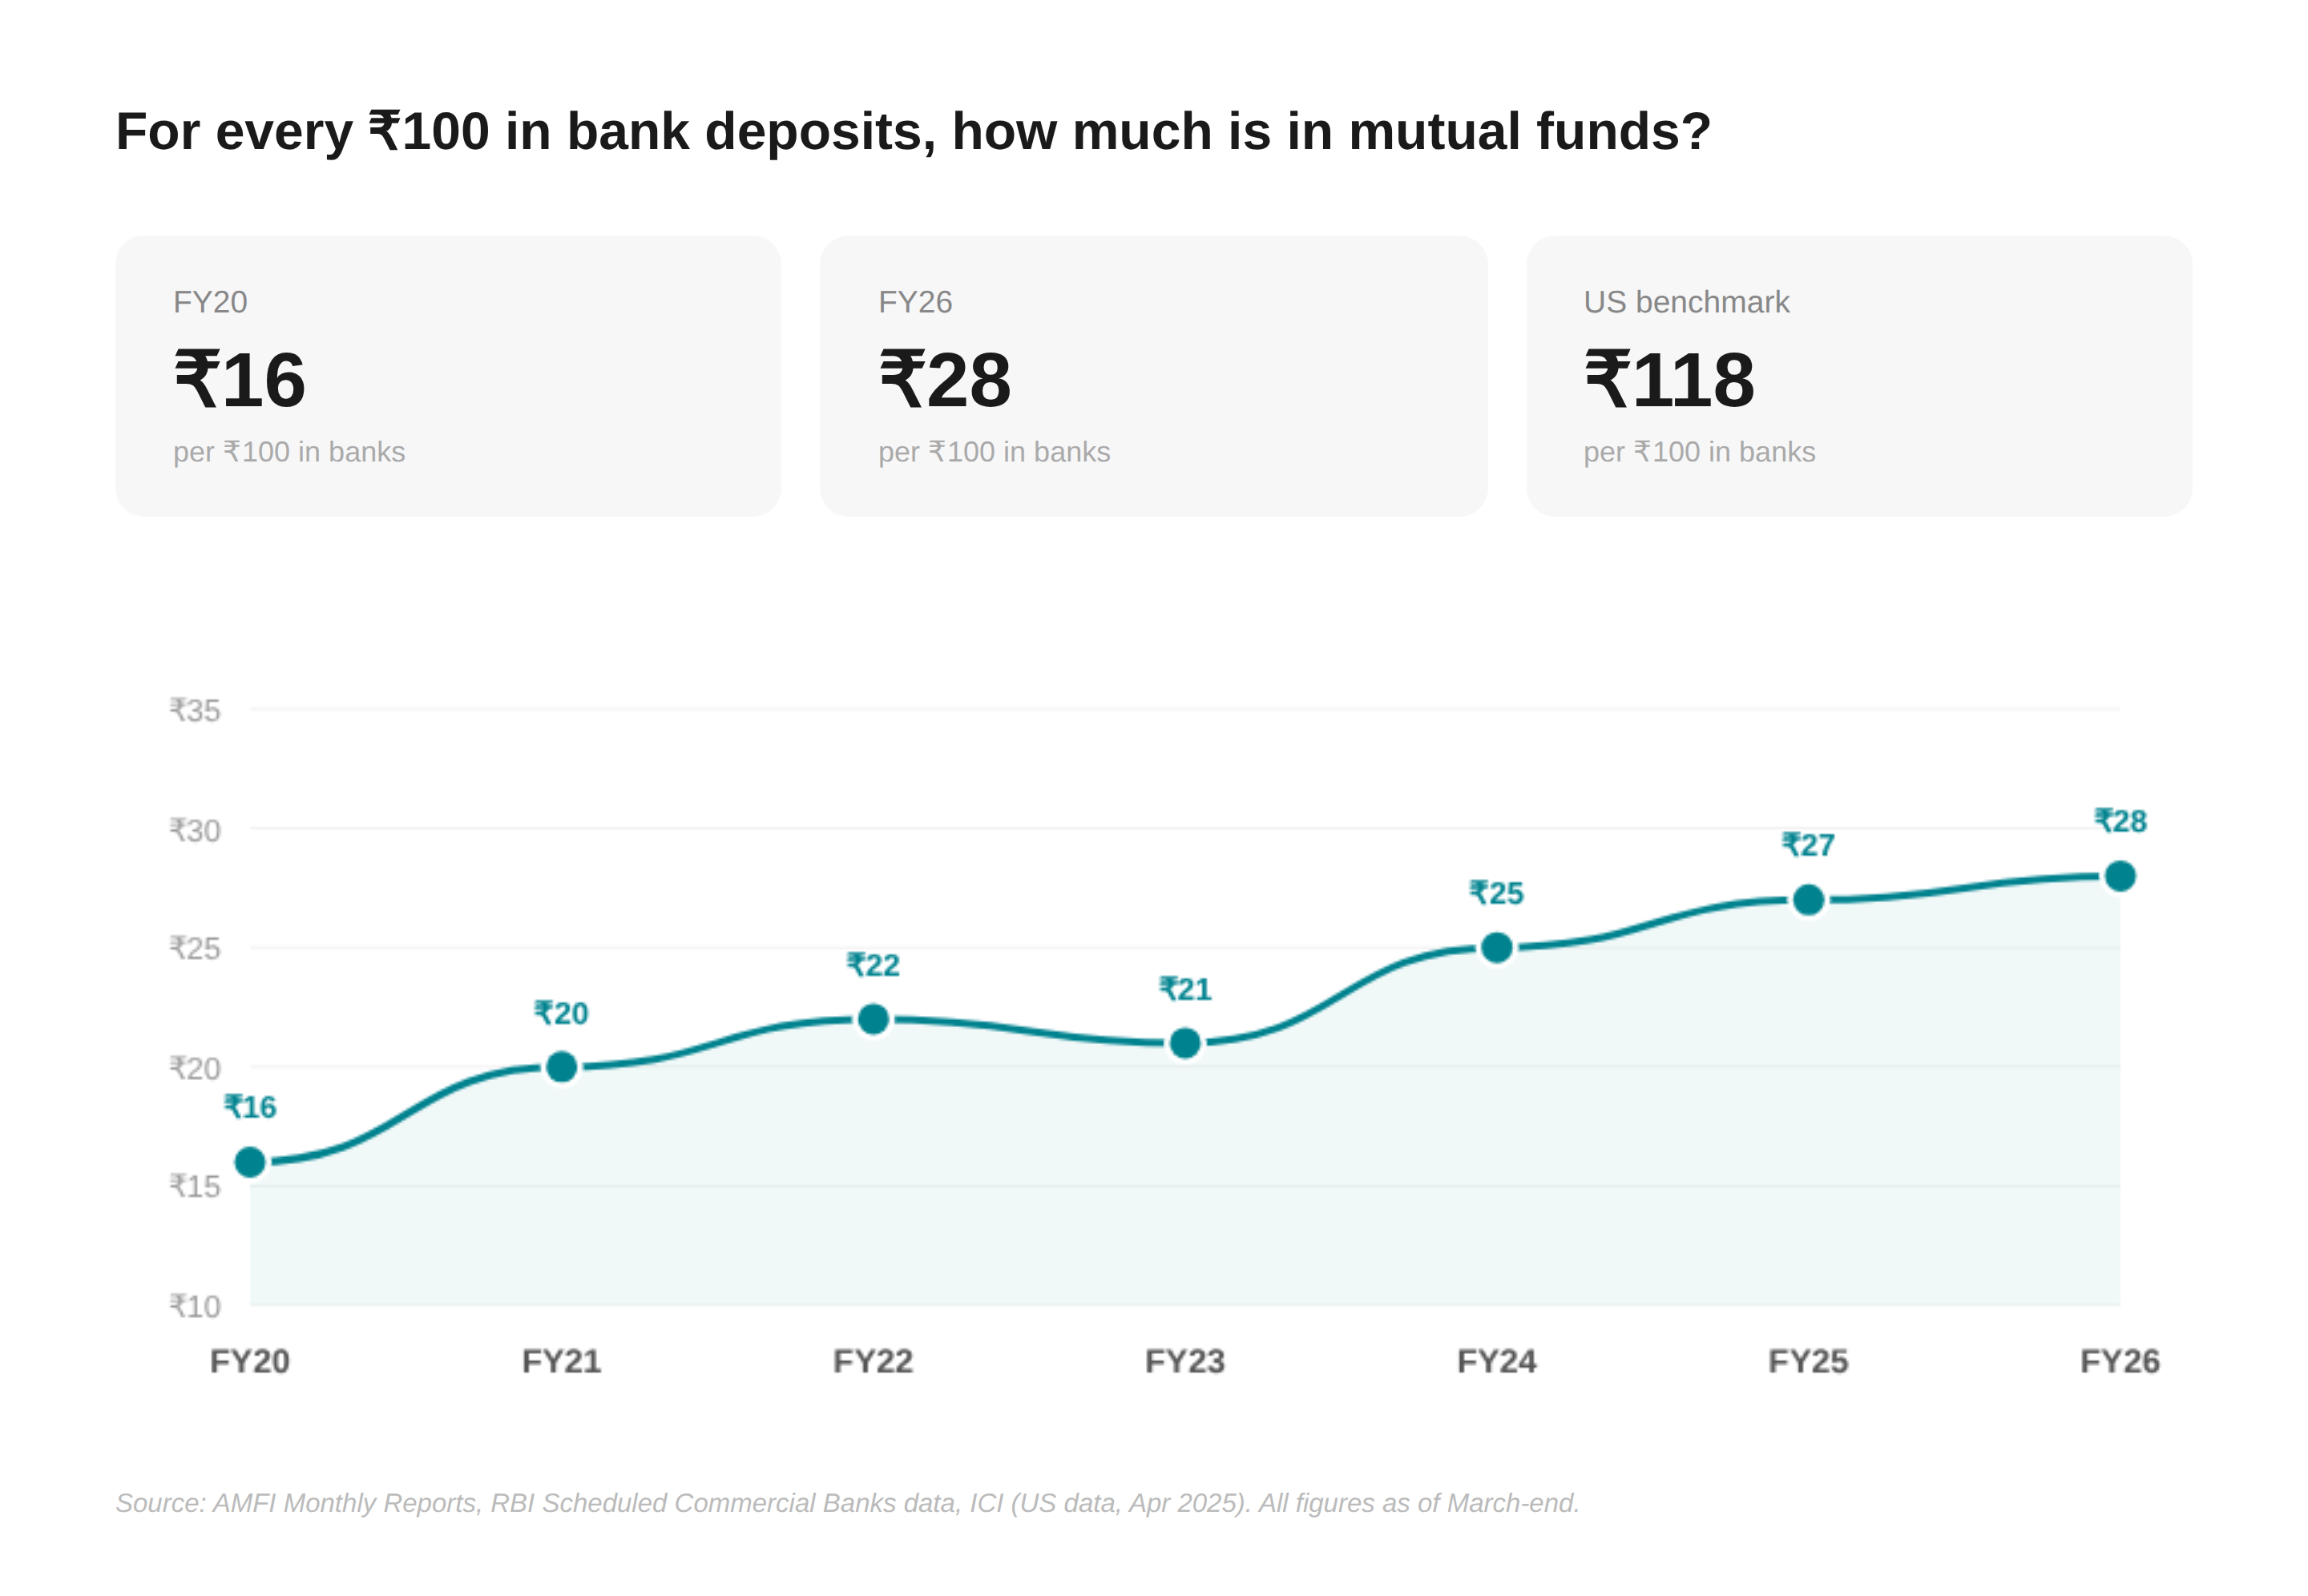
For every ₹100 sitting in an Indian bank account, ₹28.5 is now in mutual funds. Six years ago, that number was just ₹16.
That single shift tells you more about how India’s money mindset has changed than any headline ever could. But it doesn’t tell you where the money is going — and that’s where the story gets interesting.
I pulled six years of AMFI data (FY20 to FY26) and broke down every rupee. The numbers paint a clear picture: India isn’t just investing more — it’s investing very differently than it used to.
Before diving into the data, here are the biggest shifts shaping India’s mutual fund landscape over the past six years:
Key Takeaways
- India’s mutual fund industry grew from ₹22 lakh crore to ₹73 lakh crore in six years — a 3.3x jump.
- Equity AUM expanded 5.5x, while passive funds and ETFs grew 8.5x.
- Passive investing now accounts for nearly 19% of total industry AUM, up from just 7.4% in FY20.
- Small-cap and thematic funds saw the fastest growth, reflecting a sharp rise in retail risk appetite.
- India still has only ~5–6 crore unique mutual fund investors, despite a population exceeding 140 crore.
- SIP inflows continue to hit record highs, even as SIP stoppage ratios remain elevated.
The Big Picture: ₹22 Lakh Crore → ₹73 Lakh Crore
India’s total mutual fund AUM has grown 3.3x in six years — from roughly ₹22 lakh crore in March 2020 to over ₹73 lakh crore in March 2026. That’s a CAGR of ~22%.
But that 3.3x growth isn’t spread evenly. Some categories exploded. Some barely moved. And a few actually shrank. The asset-class split tells the real story.

Equity Took Over
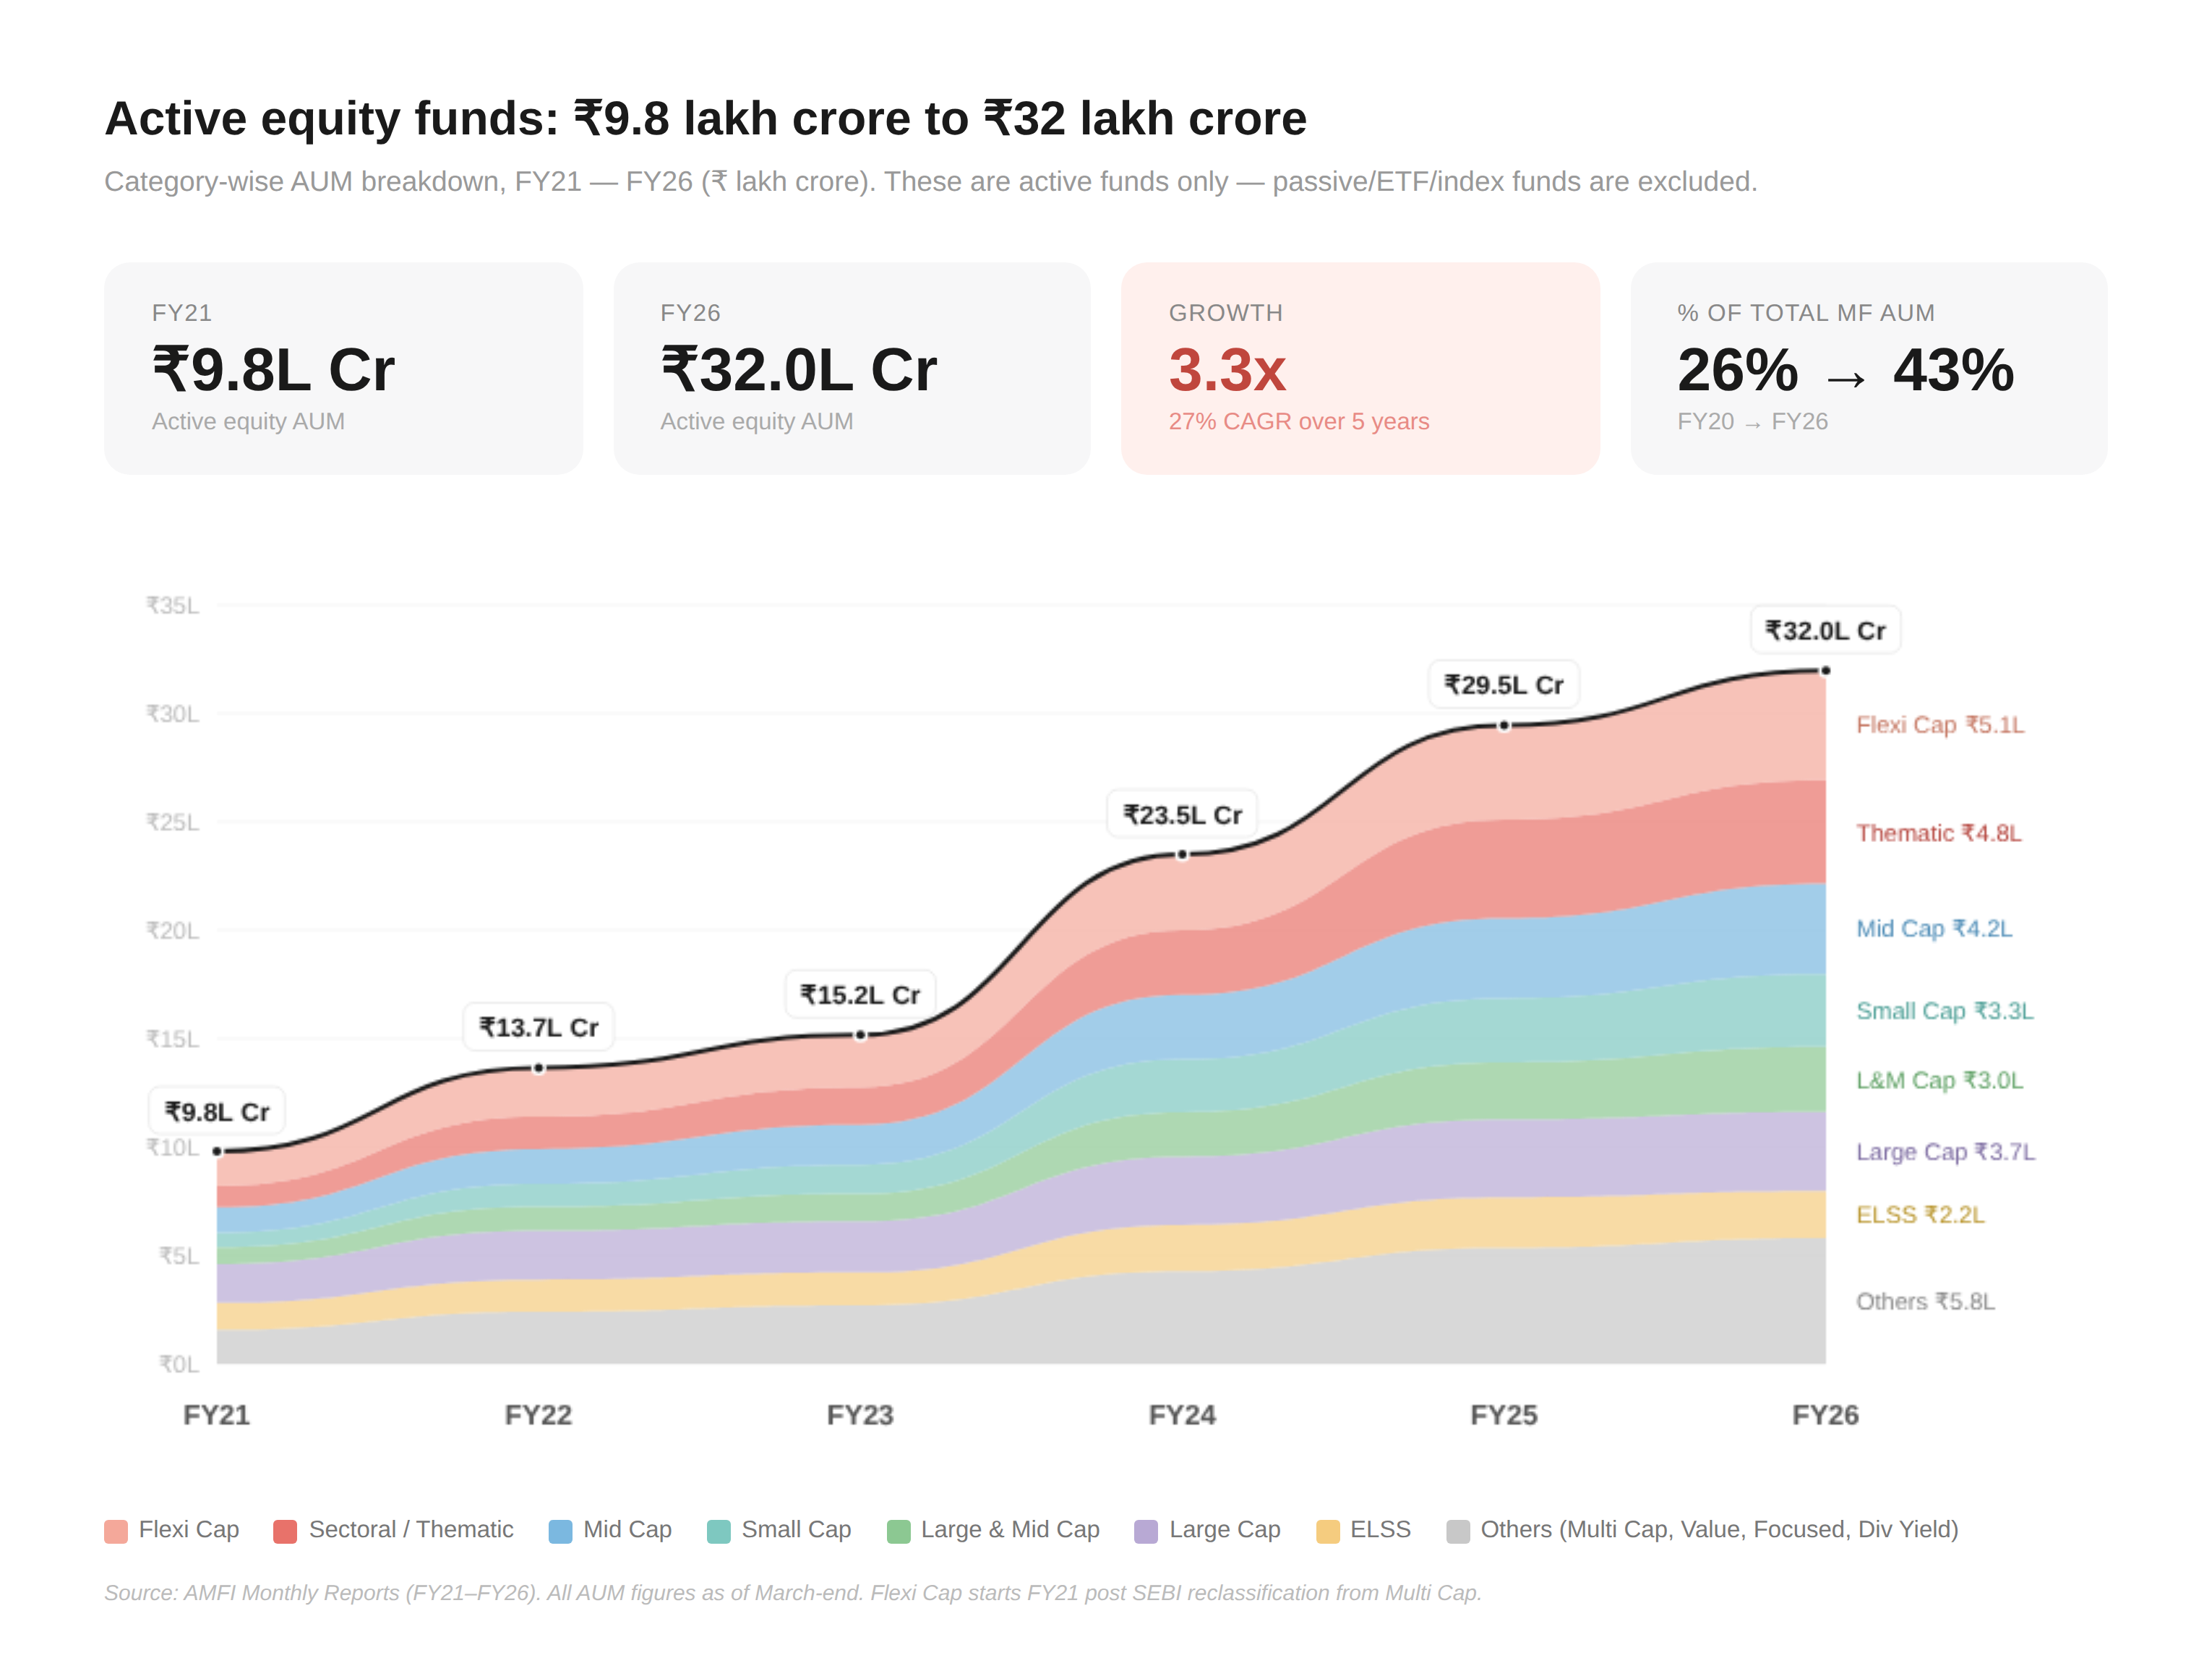
In FY20, equity-oriented schemes made up just 26% of total mutual fund AUM. By FY26, that number is 43%.
The absolute numbers are even more striking — equity AUM went from ₹5.8 lakh crore to ₹32 lakh crore, a 5.5x jump at a 33% CAGR — well above the industry’s overall 22%.
Within equity, the growth isn’t uniform either. Here’s what stands out:
Sectoral and thematic funds went from ₹49,844 crore to ₹4,77,309 crore — nearly 10x at a staggering 46% CAGR. This is, by a wide margin, the fastest-growing active equity category. Whether that’s conviction or FOMO is a debate worth having.
Small cap funds followed a similar arc — ₹35,832 crore to ₹3,34,662 crore, about 9.3x growth (45% CAGR). Mid cap funds grew 6.4x (36% CAGR). The appetite for risk clearly went up across the board.
Measuring from FY21 (post-reclassification), Flexi Cap grew from ₹1.59 lakh crore to ₹5.05 lakh crore — a 3.2x jump at a 26% CAGR. They’re the single largest active equity category.
ELSS — the tax-saving category — grew from ₹74,792 crore to ₹2,17,310 crore. Solid growth in absolute terms, but its share within equity actually fell as other categories grew faster.
The Passive Revolution Is Real
If any category tells you where the future is heading, it’s this one.
Index funds went from ₹8,089 crore to ₹3,07,315 crore. That’s 38x growth at an 83% CAGR — the highest multiplier of any category in the entire dataset.
Gold ETFs grew 21.6x — from ₹7,949 crore to ₹1,71,468 crore (67% CAGR) — riding both the global gold rally and a shift from physical gold to financial gold.
Other ETFs (largely Nifty 50 and sector ETFs) grew from ₹1.46 lakh crore to ₹8.95 lakh crore (35% CAGR).
Put it together and passive/index/ETF schemes now account for 19% of total industry AUM, up from just 7.4% in FY20 — an 8.5x jump at a 43% CAGR.
Passive investing went from a rounding error to nearly a fifth of the industry in six years.

Debt and Fixed-Income: Not Declining — Just Rebalancing
The broader debt bucket went from 46% of total AUM in FY20 to 22% in FY26. In absolute terms, it still grew from ₹10.3 lakh crore to ₹16.5 lakh crore (1.6x) — the share dropped because equity and passive grew so much faster.
The money market bucket (liquid + overnight + money market + arbitrage) went from ₹5.2 lakh crore to ₹11 lakh crore (13% CAGR).
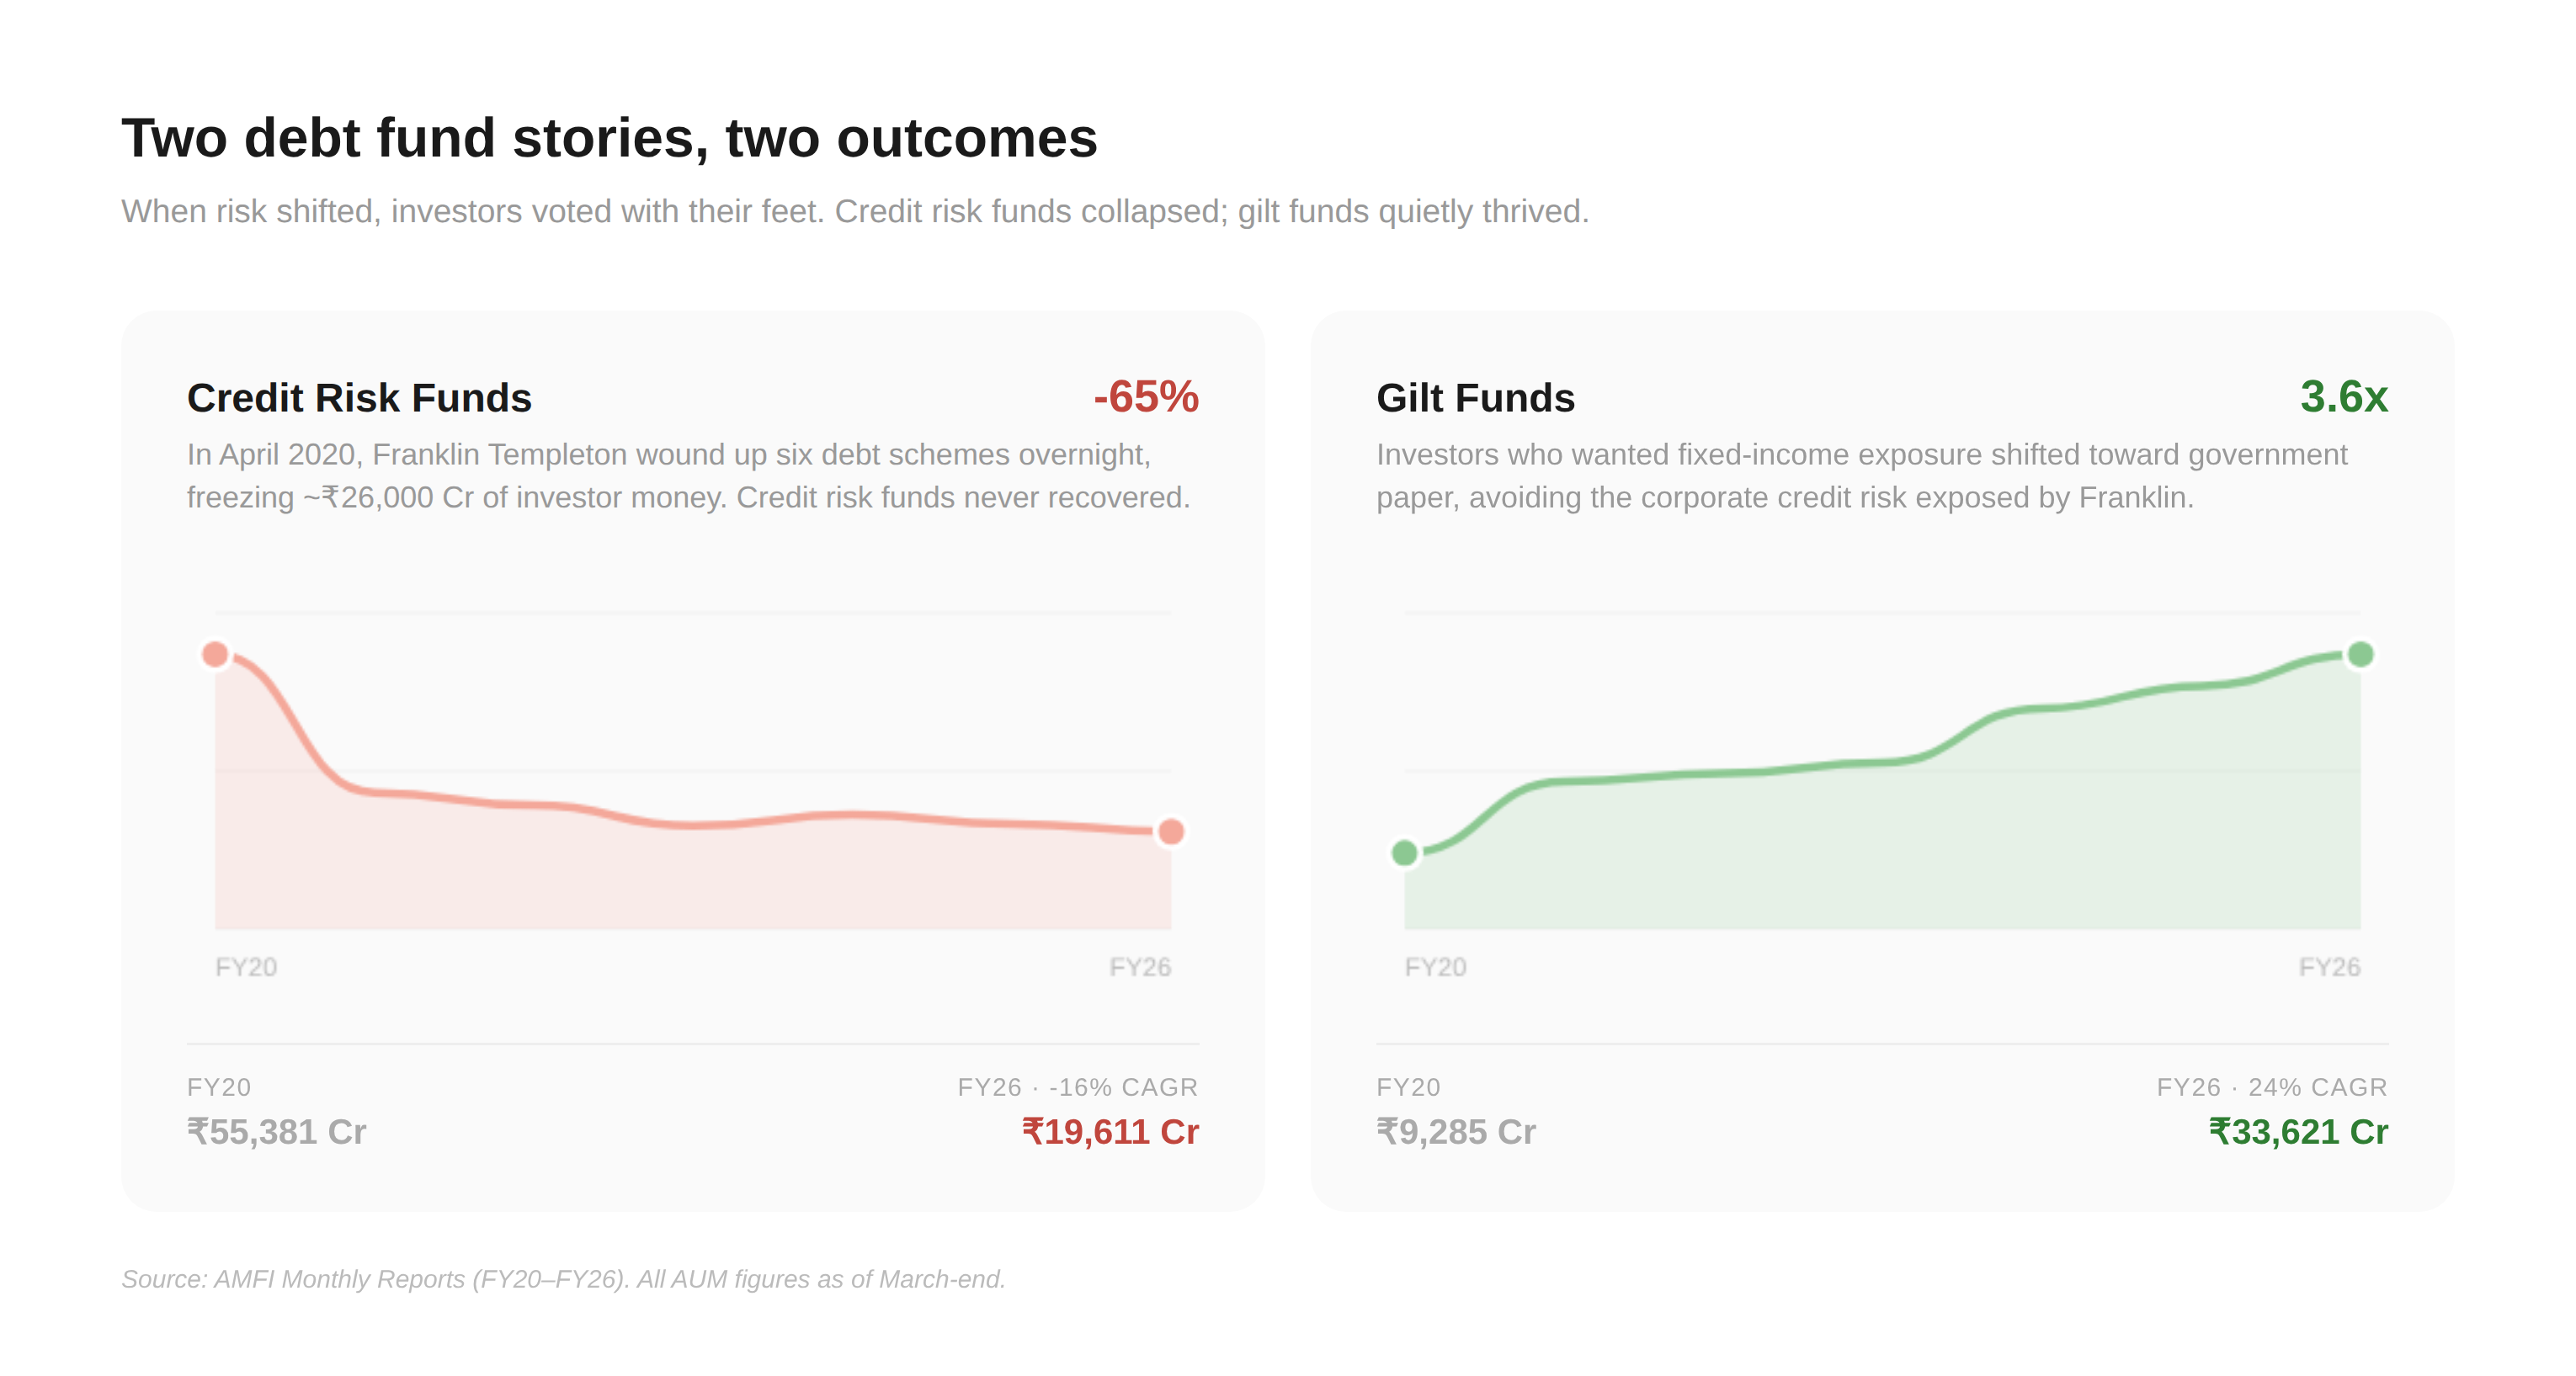
Credit risk funds tell a cautionary tale. They collapsed from ₹55,381 crore to ₹19,611 crore — a 65% fall (negative 16% CAGR). The Franklin Templeton crisis in April 2020 shattered investor confidence in this category, and it never recovered.
Gilt funds quietly grew from ₹9,285 crore to ₹33,621 crore (24% CAGR) as investors who wanted fixed-income exposure started preferring government paper over corporate credit.
The SIP Engine: ₹1 Lakh Crore to ₹3.5 Lakh Crore
If there’s one number that captures India’s shift from saving to investing, it’s the SIP contribution. Annual SIP inflows went from ₹1,00,084 crore in FY20 to ₹3,49,589 crore in FY26 — a 3.5x jump. The average monthly SIP grew from ₹8,340 crore to ₹29,132 crore. FY21 was the only year SIP collections dipped (-4%, COVID), and every year since has been higher than the previous.
SIP AUM tells the compounding story — it went from ₹2.65 lakh crore to ₹15.11 lakh crore, now accounting for about 20.5% of total industry AUM. Outstanding SIP accounts crossed 10 crore in November 2025, settling at 10.45 crore by March 2026.
But there’s a number that doesn’t get enough attention: the SIP stoppage ratio. This is the ratio of SIPs discontinued to new SIPs registered. The ideal range is 40-45%. India hit that only once — FY22, at 41.74%. In FY25, the ratio spiked to 75.63%, well above even the COVID peak of 60.88%. FY26 is running at roughly 75% as well (excluding a one-time SEBI dormant folio cleanup in April 2025 that distorted the ratio to 353%).
So how are SIP inflows still growing if stoppage is at all-time highs? The answer is ticket size. The average SIP contribution per folio has been climbing — from ₹2,690/month in FY20, it dipped to ₹1,977 in FY22 (as a flood of small-ticket retail investors joined during COVID), then steadily recovered to ₹2,788/month in FY26. The SIPs being closed today are overwhelmingly older, smaller-ticket SIPs (₹500-₹1,000/month from 2017-2018). The new SIPs coming in are larger. In rupee terms, one new SIP today replaces several old ones.
The stoppage ratio is a participation health metric, not a flow metric — and right now, both are diverging.

More Folios, but How Many New Investors?
The folio counts tripled — from 8.97 crore in FY20 to 27.39 crore in FY26 (20% CAGR). Headlines love this number.
But unique investors grew from 2.1 crore to 5.9 crore (19% CAGR) — almost the same pace.
India has only around 5.5–5.9 crore mutual fund investors despite a population exceeding 140 crores, implying mutual fund penetration of barely 4%–5%. In comparison, the United States has roughly 12.8 crore individual mutual fund investors in a population of about 34 crores, implying participation levels close to 38%. Over 56% of US households own mutual funds or related investment products including ETFs, as per the ICI 2025 report. Several other major economies also have significantly deeper retail participation. Japan’s mutual fund penetration is estimated at around 20%, while emerging markets like China and Brazil also have higher retail investment participation than India — though direct comparisons are complicated by differences in how fund products are structured across these markets.
The Bain & Company–Groww ‘How India Invests 2025’ report projects mutual fund penetration in India could double to 20% by 2035, with AUM crossing ₹300 lakh crore. The runway isn’t just enormous — it’s arguably the biggest growth opportunity in global asset management right now.

What Could Slow This Trend?
A prolonged equity bear market could test the durability of India’s retail investing boom, particularly in thematic and small-cap categories where return expectations may now be elevated.
Much of the industry’s recent growth has occurred during a period of exceptionally strong equity returns and rising retail participation. A sustained drawdown would reveal how much of the inflow momentum is truly long-term capital versus performance-chasing behavior.
The real test for India’s mutual fund industry may not be growth during a bull market, but investor behavior during a difficult one.
What Does This All Mean?
Six years of data tell a few clear stories:
Passive investing has gone mainstream. Index funds and ETFs went from a niche corner to 19% of total AUM. This trend has room to run — in the US, passive funds hold more than half of total mutual fund assets.
Thematic and small cap appetite is at all-time highs. Whether this sustains through a real downturn is the question nobody wants to ask right now.
The investor base is still narrow. 5.9 crore unique investors is impressive growth, but it’s barely scratching the surface of India’s population. The next leg of growth — whenever it comes from Tier 2 and Tier 3 cities — could make the current AUM look small.
And that ₹28.5 for every ₹100 in bank deposits? It was ₹12.6 in 2015. At this pace, mutual funds could cross ₹40 for every ₹100 in bank deposits within the next few years. But here’s the real context: in the US, mutual fund AUM stands at roughly 118% of bank deposits — meaning Americans have more money in mutual funds than in their bank accounts. In developed economies, crossing 100% (Europe and Japan remain bank-deposit heavy), but the US shows what’s possible when financial literacy and retirement-linked investing reach scale. India at 28.5% still has a very long runway.
India isn’t just saving anymore. It’s investing. And the data makes that impossible to ignore.
Data source: AMFI Monthly Reports (FY20–FY26), RBI Scheduled Commercial Banks data. All AUM figures as of March-end of each financial year.